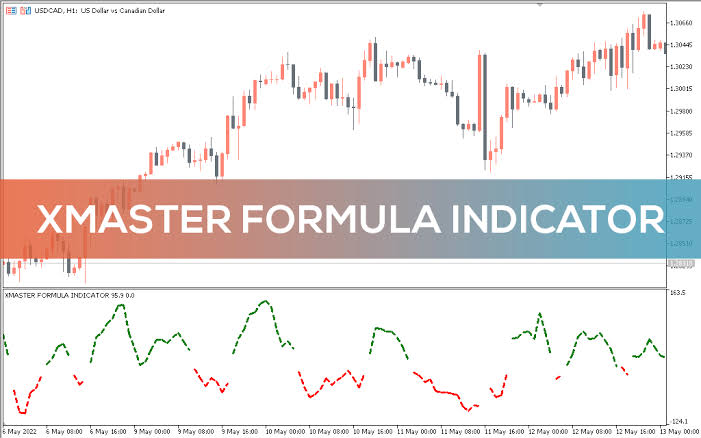
Many people like to trade in the Forex market without using indicators, a method called naked Forex trading or pure price action trading.
Many traders who follow price action use to measure how much the prices change, called volatility. This measure comes from a forex volatility indicator.
In this article, timeframetech will explain what forex volatility indicator is, the types and comparison between them.
Definition Of Forex Volatility
Volatility can be defined in a few different ways. The simplest way to understand Forex volatility is by looking at the range of the currency rate’s prices, which is the difference between the highest and lowest prices in a certain period.
If the range is wide, the currency pair is more volatile. For example, if a currency pair’s highest price is much higher than its lowest price during the day, it means the currency pair is very volatile.
More generally, volatility can also be thought of as how much the FX rate changes, either expected or based on past data.
There are many indicators, each using a different formula, to calculate the exact value of volatility. A forex volatility indicator can help traders understand and predict these changes.
Volatility is very important in creating a Forex trading strategy because it shows how likely the currency rate is to change.
To make money from trading in Forex, the currency rate needs to change. If it doesn’t change, you won’t make a profit unless you are trading options, which is different.
Some Forex Volatility Indicators That Traders Use
Here are some of the most commonly used forex volatility indicators:
Average True Range (ATR)
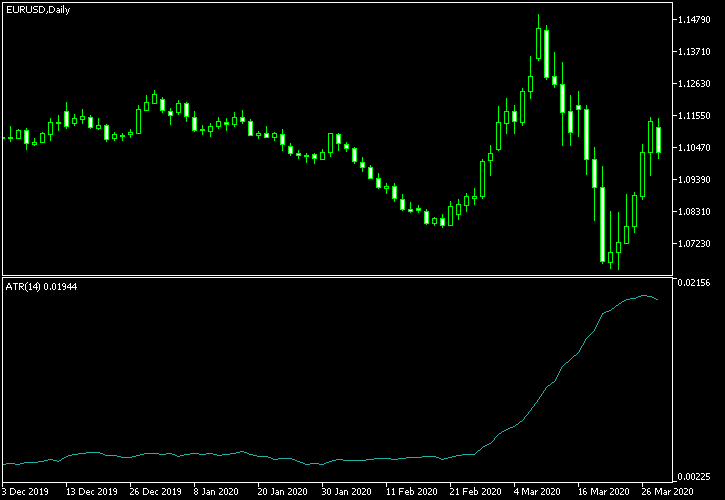
This indicator calculates the average true range over a number of chart candles. It’s great if you want to quickly see how much the price has changed during the last few periods.
Traders use ATR for setting entry levels when they expect a big move and for adjusting the size of their positions based on how volatile the market is.
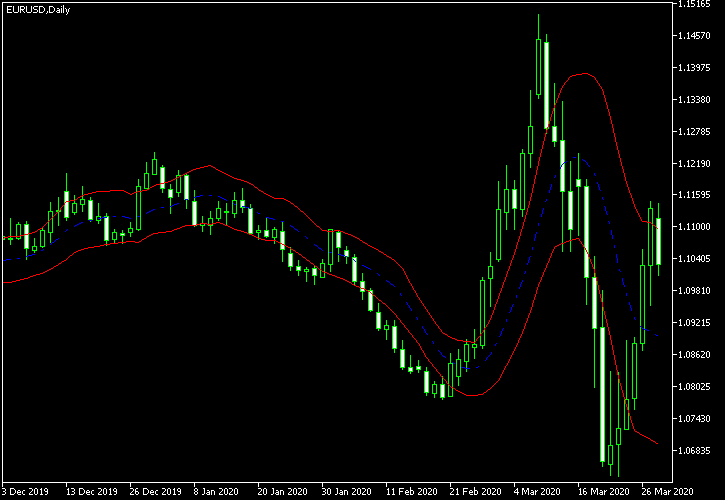
Bollinger Bands (BB)
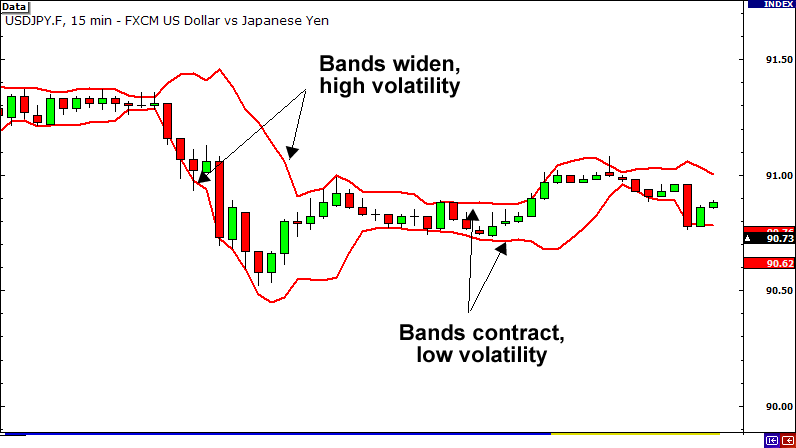
This is another common forex volatility indicator found in all charting platforms. Bollinger Bands measure volatility by calculating the currency rate’s standard deviation and then adding and subtracting this from a moving average.
This creates bands that widen during high volatility and get closer together during low volatility. Bollinger Bands can be used in many ways in trading, and measuring volatility is just one of them.
Chaikin Volatility
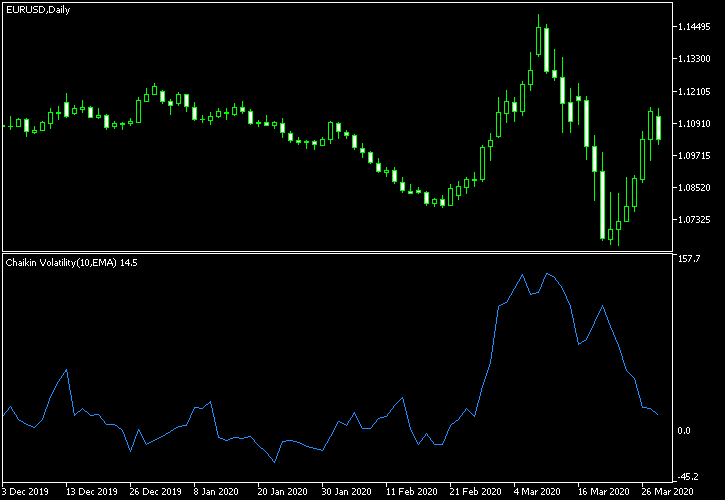
Don’t confuse this with the Chaikin Oscillator. This less popular indicator calculates volatility by comparing the change in the average high-low difference over time.
Sometimes, during long periods of high volatility, it might show near-zero values. Even so, it can still be useful for comparing volatility at different times.
Keltner Channel
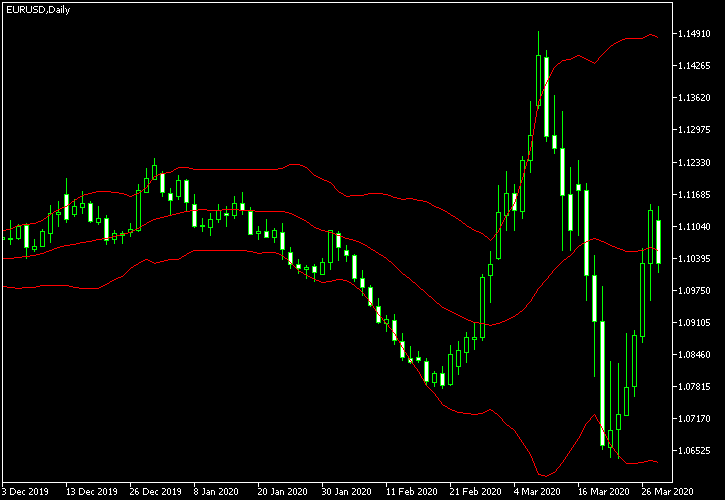
Although not as commonly found in trading platforms, the Keltner Channel is a popular forex volatility indicator. It’s similar to Bollinger Bands but uses a moving average of the typical price for the middle line.
It then adds and subtracts the moving average of the high-low difference to form the bands. Like Bollinger Bands, the Keltner Channel gets wider when volatility increases.
VIX (Volatility Index)
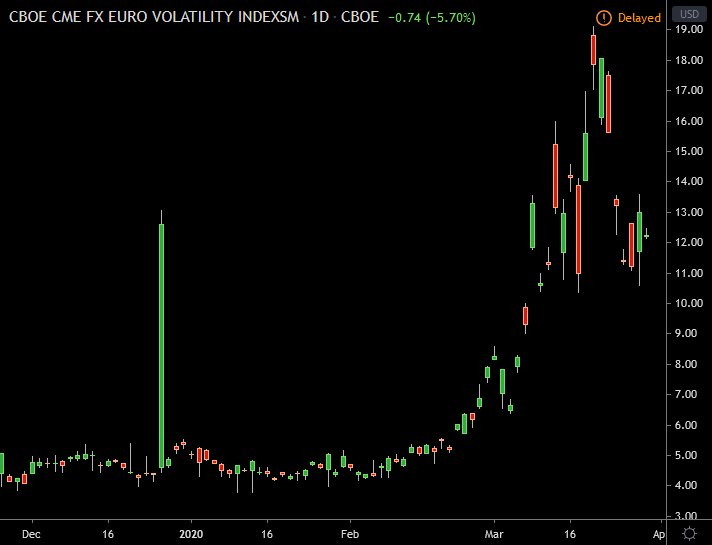
Most volatility indicators show realized volatility, which is how much the price has changed in the past. VIX, on the other hand, shows implied volatility, which is how much the market expects prices to change in the future.
The VIX is a Volatility Index by CBOE and is based on S&P500 index options. While it’s mostly used for stocks, there are special versions of VIX for Forex traders, such as EUVIX for the euro, JYVIX for the Japanese yen, and BPVIX for the British pound. However, VIX is more advanced and not as easy to use as other forex volatility indicators.
Volatility Ratio (Schwager)
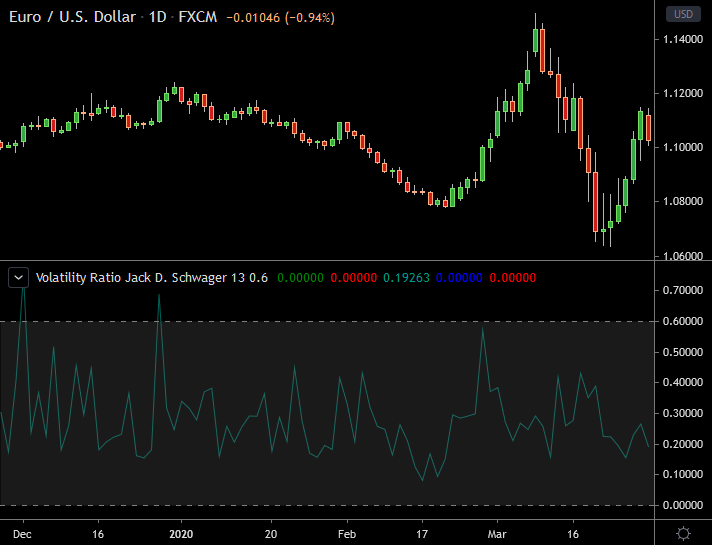
This forex volatility indicator is calculated as the ratio of the current true range to the exponential moving average of the true range.
It shows how the current true range compares to previous candles. This indicator is usually found as a custom tool for trading platforms.
When traders want to measure market volatility, they often prefer simpler forex volatility indicators. That’s why many choose the ATR over other technical indicators.
However, they might also use VIX currency versions when they need to understand long-term implied volatility for major currencies like the euro, yen, or pound.
Read More: Timeframetech
How to Use Forex Volatility Indicator in Trading Strategies
Now, let’s see how traders use these forex volatility indicators in their trading strategies.
One common strategy is called a breakout strategy. Traders look for times when the price breaks out of a certain range. For example, if the price has been moving between $1.10 and $1.20 for a while and suddenly goes above $1.20, this is a breakout.
Traders might use the ATR to see if the breakout is strong. If the ATR is high, it means the price is moving a lot, and the breakout could be real. They might then decide to buy the currency pair, hoping the price will keep going up.
Another strategy involves using Bollinger Bands. Traders watch the bands to see if the price is moving towards the top or bottom band.
If the price touches the top band, it might mean the currency pair is overbought and could soon go down. If it touches the bottom band, it might be oversold and could go up. Traders use this information to decide when to buy or sell.
Traders also use volatility indicators to adjust the size of their trades. If the market is very volatile, it can be riskier to trade. So, traders might use a smaller trade size to protect themselves from big losses.
For example, if the ATR shows high volatility, a trader might decide to trade less money to reduce their risk. This is called position sizing.
Using multiple forex volatility indicators can give traders a better picture of the market. For instance, they might use both the ATR and Bollinger Bands together.
The ATR can show how much the price is moving on average, while Bollinger Bands can show where the price might be heading. By combining these indicators, traders can make more informed decisions.
It’s also important for traders to keep an eye on long-term volatility. This helps them understand the bigger picture of the market.
Indicators like VIX can show what traders expect the market to do in the future. For example, if the VIX for the euro is high, it means traders expect a lot of price changes for the euro. This can help traders prepare for future market movements.
Comparing Different Forex Volatility Indicators
1. Average True Range (ATR)
How it works:
- Shows the average range of price movements over a certain number of days.
Pros:
- Simple and easy to use. Gives a clear picture of how much the market is moving.
Cons:
- Only shows past volatility, not future expectations.
Best for:
- Beginners and setting stop-loss orders to protect against big losses.
2. Bollinger Bands
How it works:
- Creates bands around the price using standard deviation. Bands get wider with high volatility and narrower with low volatility.
Pros:
- Provides a visual way to see volatility. Helps identify if the market is overbought or oversold.
Cons:
- Can be complex for new traders to understand at first.
Best for:
- Visual traders and timing trades (buying low, selling high).
3. Chaikin Volatility
How it works:
- Compares the difference between high and low prices over time to show changes in volatility.
Pros:
- Good for seeing how volatility changes over time.
Cons:
- Can be confusing and may show near-zero values during long periods of high volatility.
Best for:
- Understanding trends in volatility and making trade decisions based on these trends.
4. Keltner Channel
How it works:
- Similar to Bollinger Bands but uses the average true range to create the bands.
Pros:
- Shows when the market is overbought or oversold. Useful for those who prefer using ATR.
Cons:
- Less common and might be harder to find on trading platforms.
Best for:
- Traders who like using the average true range in their analysis.
5. VIX (Volatility Index)
How it works:
- Shows how much people expect prices to change in the future. Special versions exist for Forex trading (e.g., EUVIX for the euro).
Pros:
- Provides future market expectations. Useful for long-term planning.
Cons:
- More advanced and might be harder for beginners to understand. Not always available in real-time.
Best for:
- Experienced traders and those planning long-term trades.
See Also: Tech Skills For You
Conclusion
Volatility is a key concept in Forex trading because it shows how much the price of a currency pair is likely to change.
Understanding and using different forex volatility indicators is essential for anyone involved in Forex trading.
These tools help traders gauge how much the prices of currency pairs are likely to change, which is crucial for making informed decisions.
By using a forex volatility indicator, traders can get a clearer picture of the market and improve their trading strategies.
Whether they use ATR for its simplicity or VIX for its advanced insights, these indicators are crucial for understanding and operating the Forex market.
Join our telegram community to learn free tech skills, get up-to-date tech news, educational tech materials, free fintech online classes, that will help you grow and become profitable.